Boosting Android App Performance: Unmasking Memory Leaks with Android Profiler
A Comprehensive Guide to Optimizing Android Apps through Effective Memory Management and Leak Detection
Hello there 👋! If you've ever had to wrestle with the dreaded OutOfMemoryError, or if your app is running slower than a tortoise at a marathon, you're in the right place. In this article, we'll explore how to enhance app performance by using Android Profiler for memory leak detection. Buckle up, let's get started!
Memory Leaks
Let's start with a little story. Imagine you're a landlord and you've got a tenant (let's call him Mr. Object) who has overstayed his welcome. He's taking up valuable space and refusing to leave, even though he's not needed anymore. That is a memory leak in a nutshell.
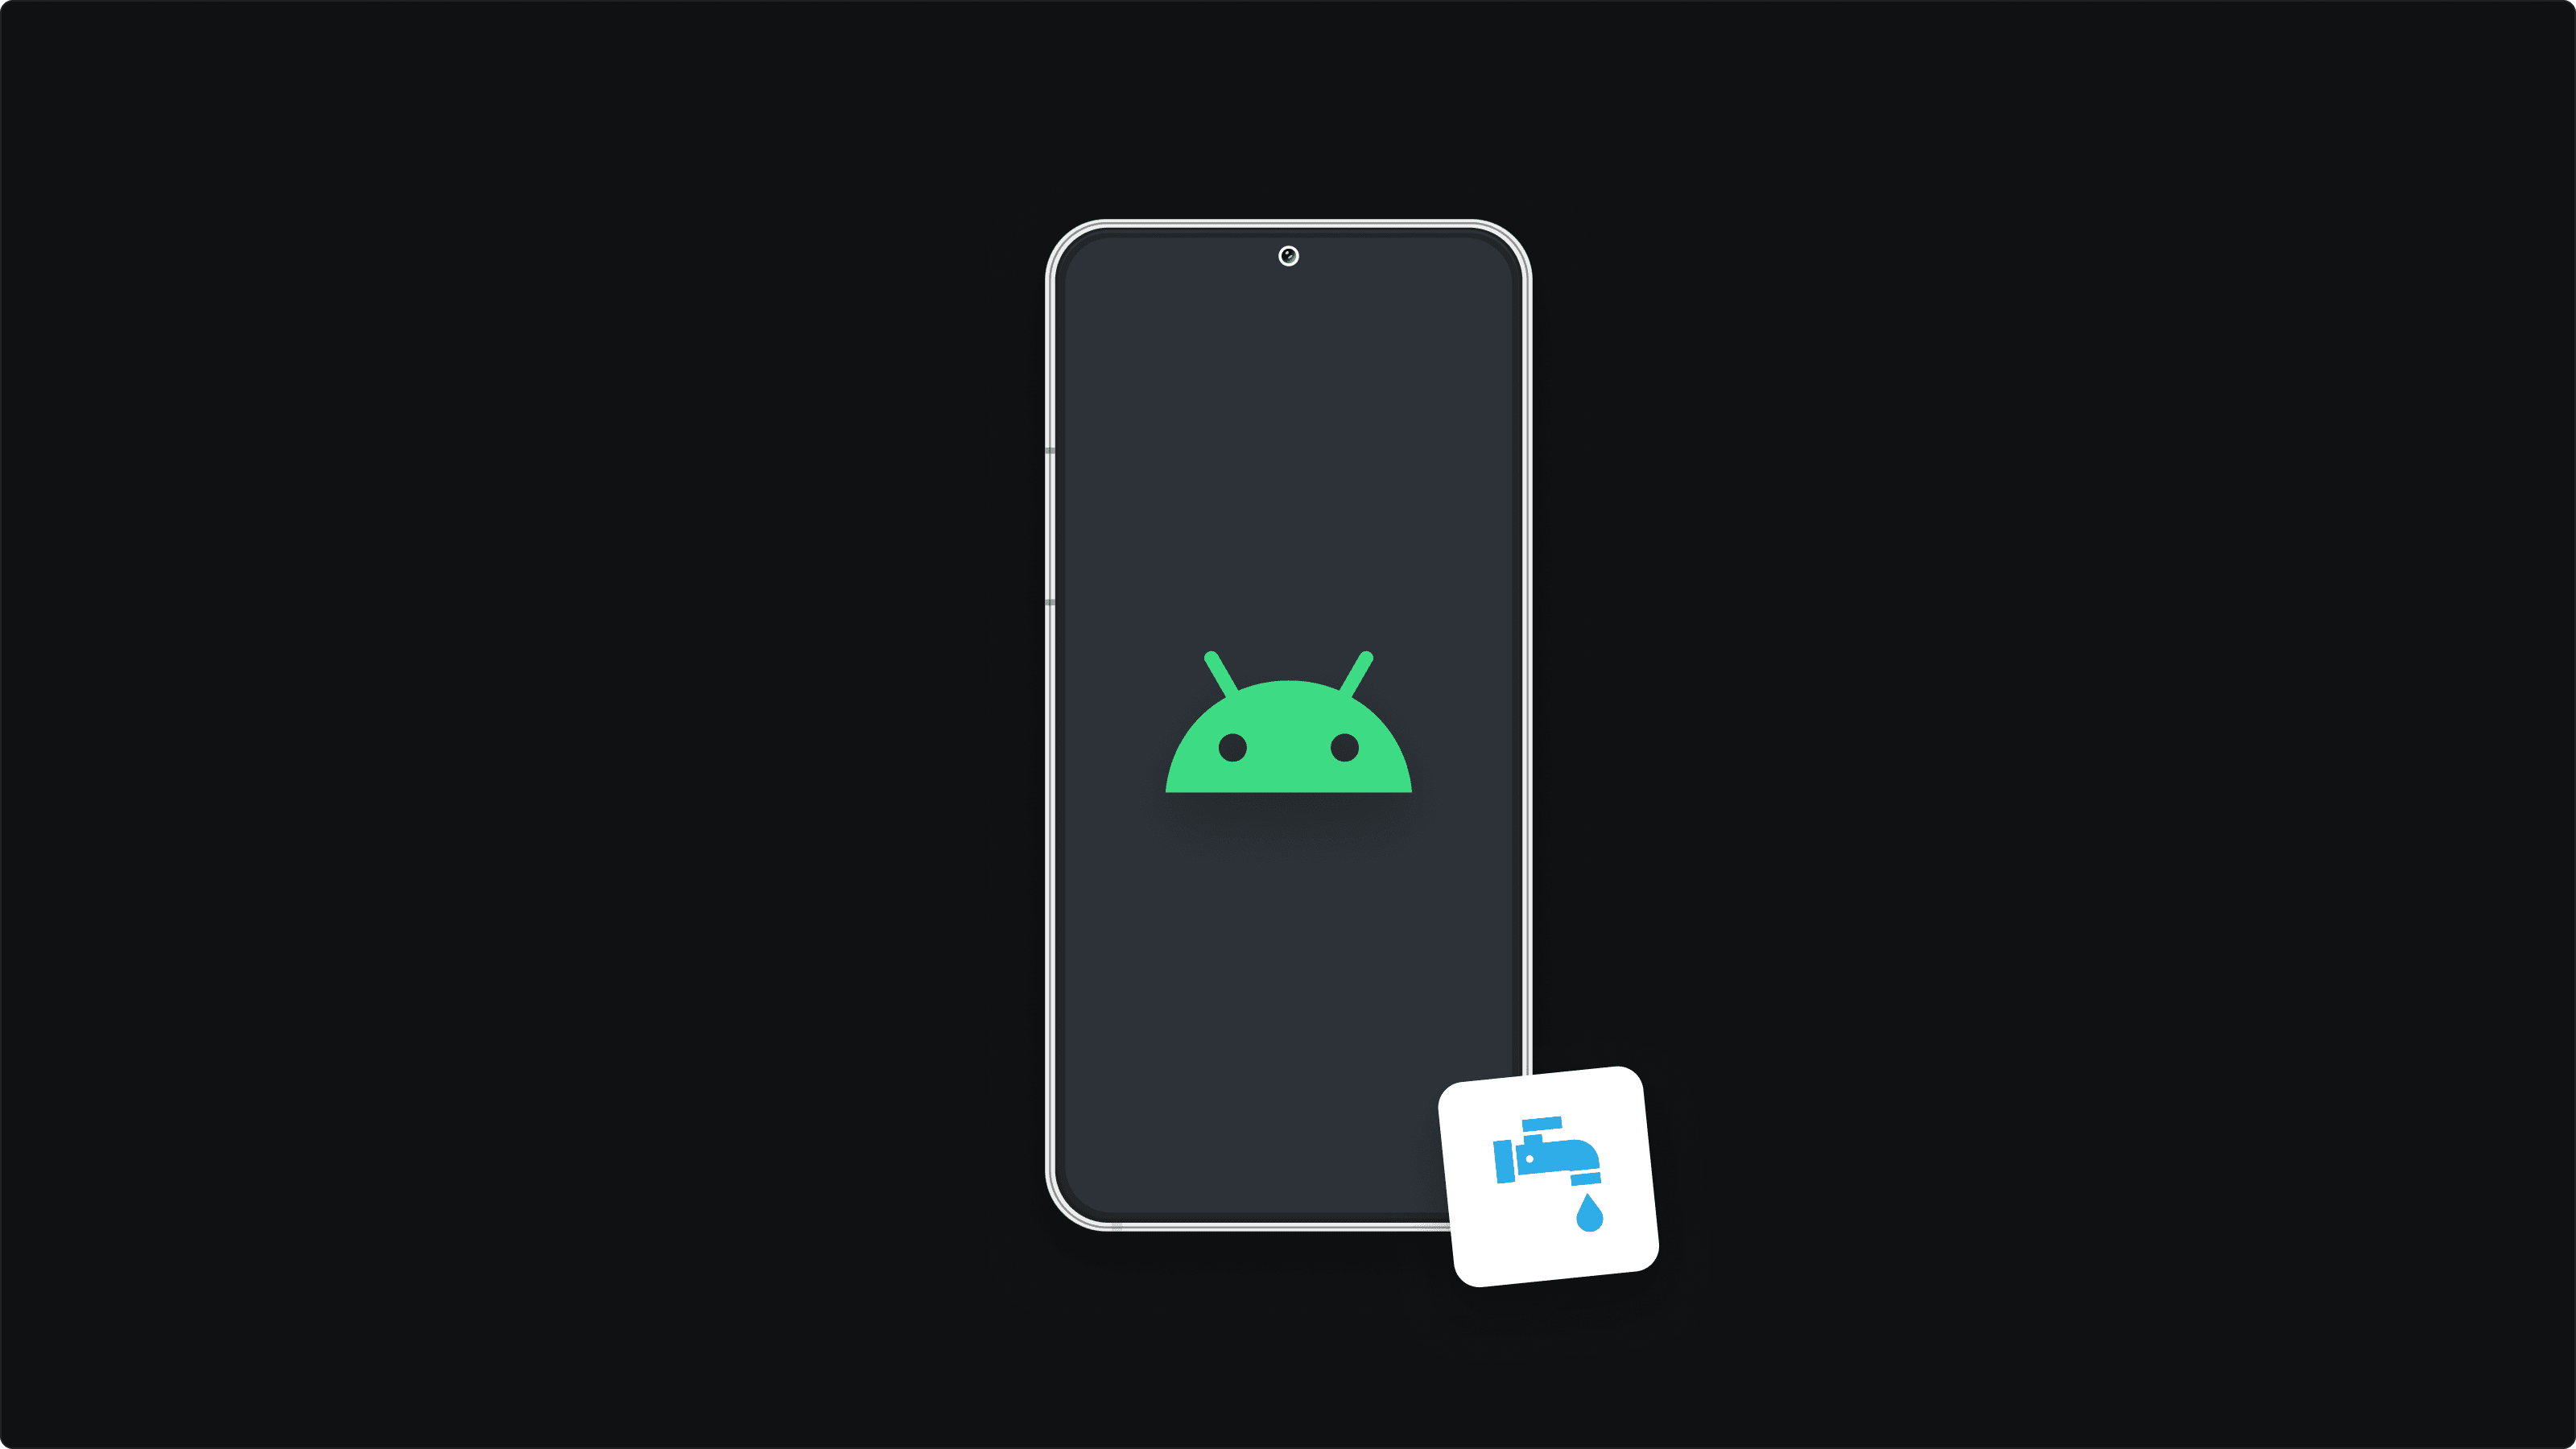
In the context of Android development, memory leaks can sneak up on you when an object is no longer needed but is still hanging out in memory because its reference hasn't been cleared. These memory leaks can slow down your app, or worse, cause it to crash. Not a good user experience, right?
Garbage Collection
Garbage Collection (GC) is like a superhero for memory management. It swoops in and reclaims memory from objects that are no longer needed. But, like all heroes, GC has its limitations. It can't handle objects that are still referenced, even if they're not needed. So, dear devs, managing references properly is key to preventing memory leaks.
Android Profiler
Let's get to the heart of the matter: the Android Profiler, a tool baked right into Android Studio. It provides real-time data about your application's memory usage, helping you to optimize your app.
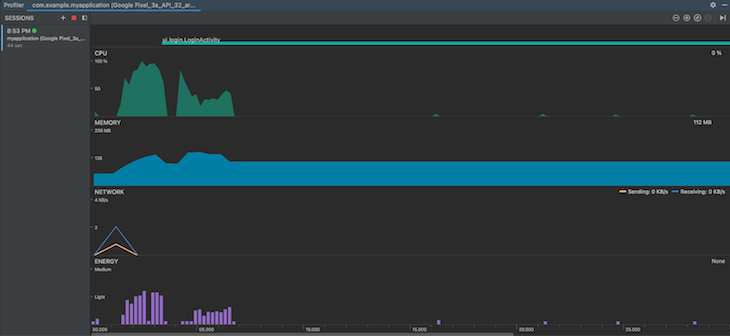
To open the Android Profiler, click View > Tool Windows > Profiler or click the Profiler icon in the toolbar. Got it? Great! Let's dive deeper.
Hunting Memory Leaks with Heap Analysis in Android Profiler
Step 1: Snap a Heap Dump
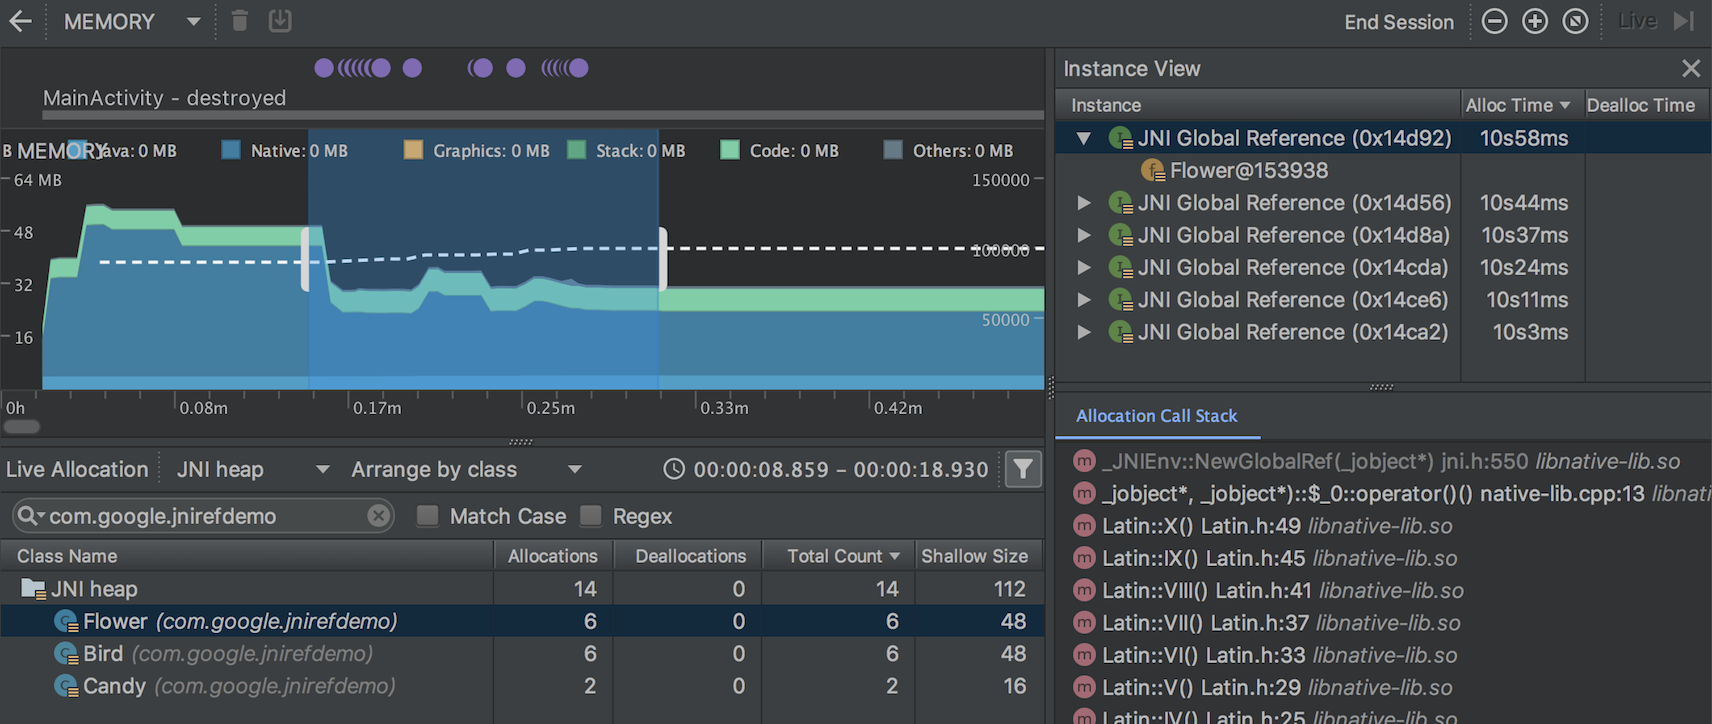
First, fire up your application and navigate to the feature you suspect is causing the memory leak. Open the Android Profiler and click on the 'Memory' timeline. Hit the 'Dump Java Heap' icon on the top right of the memory profiler. Voila! You've captured a snapshot of your app's memory.
//example code to create memory leak
public class MainActivity extends AppCompatActivity {

    private static Context context;

    @Override
    protected void onCreate(Bundle savedInstanceState) {
        super.onCreate(savedInstanceState);
        setContentView(R.layout.activity_main);

        context = this;
    }
}
See this cheeky line of code above? This is an example of a potential memory leak where the Context reference is held statically.
Step 2: Heap Dump Analysis
Once you have the heap dump, you can analyze it. Sort by 'Shallow Size' to see which instances are hogging the most memory. If there's an instance that's taking up a lot of memory and shouldn't be there, it might be the culprit causing your memory leak.
class ExampleLeak {
    private final List<byte[]> leak = new ArrayList<>();

    void leakMemory() {
        leak.add(new byte[1024 * 1024]); // 1MB leak each time
    }
}
In the above example, every time leakMemory() is called, we're adding 1MB of data to our list, which can quickly pile up and cause a memory leak.
Step 3: Detecting the Leak
Now that you have identified a potential memory leak, it's time to dig deeper to find the root cause. Click on the suspected instance to bring up the 'Instance View'. Here, you'll see what is holding references to the instance and preventing it from being garbage collected.
class LeakySingleton {
    private static LeakySingleton instance;
    private final Context context;

    private LeakySingleton(Context context) {
        this.context = context;
    }

    static LeakySingleton getInstance(Context context) {
        if (instance == null) {
            instance = new LeakySingleton(context);
        }
        return instance;
    }
}
The above code snippet shows a common source of memory leaks - a singleton class holding a reference to a Context. Singletons live as long as the application does. If we pass an Activity's context to this singleton, the Activity cannot be garbage collected even after it's destroyed, since our singleton friend is still holding onto it. This, my friends, is a classic case of a memory leak.
In the 'Instance View' of Android Profiler, check out the 'References' section. It will show a tree of references that are holding onto the instance. You can follow these references up the tree to find the source of the leak.
Stepping up Your Game: Advanced Tactics
Having reached this point in the article, you have already acquired significant knowledge regarding memory leak detection. However, to further enhance your skills and adopt a more proficient approach to managing memory leaks, consider the following advanced strategies:
Use Libraries: Libraries like LeakCanary can automatically detect and notify you of memory leaks in your app during development. It's like having a little birdie whispering in your ear, "Hey, there's a memory leak here!"
Automate Memory Leak Detection: You can automate the detection of memory leaks as part of your CI/CD pipeline. Running instrumentation tests with LeakCanary or a similar tool can help you catch memory leaks before your code even hits production.
Educate Your Team: Sharing knowledge with your team about memory leaks and best practices for memory management can prevent memory leaks in the first place. Remember, prevention is better than cure!
Wrapping Up: The Road to Android Optimization
So there you have it! You're now well-equipped with a solid understanding of memory leaks, Android Profiler, and how to leverage these tools and techniques to optimize your Android application.
Remember, app optimization and app performance are two sides of the same coin. Embrace these techniques to create seamless, crash-free experiences for your users, and let your Android development journey be a fun-filled adventure!
If you found this article helpful, do share it with your friends and colleagues in the field of Android development.
Stay tuned for more exciting content.
Happy coding!